Using web analytics correctly: How to optimise your company website

Web analytics is an important tool that makes it possible to analyse the performance of a website in detail and understand how visitors interact with it. From user segmentation to analysing cart abandonment, web analytics provides insights that enable companies to precisely align their digital strategy. In this blog, we dive into the depths of web analytics, explore its benefits, introduce common tools and discuss how organisations of all sizes can use web analytics to improve their digital experience.
What is web analytics
Web analytics collects, analyses and reports on web data to improve the understanding of users' online behaviour and optimise the website experience. It is not just about how many people visit a page, but also what they do there, how long they stay and what makes them leave. Web analytics is therefore an evaluation of user behaviour with the aim of improving the overall performance of the website.
What are the benefits of web analytics?
A website is often the first point of contact between a company and its customers. Thorough web analytics helps to understand and improve this first impression. In summary, it enables website operators to measure the effectiveness of their content, evaluate marketing strategies and identify technical problems.
Analysing the website can help in the following ways:
- Get a clear picture of your target audience segment
- Personalise the website for customers who visit it repeatedly.
- Monitor the amount of money spent by individual customers or specific groups of customers.
- Identify weak points of the website for an improved user experience and usability.
- Important findings about cancellation points in the purchase process
- Observe the geographic regions from which the most and least customers visit the website
- Insights into the effectiveness of paid campaigns
- Predictions about which products customers are most and least likely to buy in the future
Common web analytics tools
There are a variety of web analytics tools available - from the most widely used free tool, Google Analytics, to advanced solutions such as Adobe Analytics or heatmapping tools like Hotjar. These tools provide a wealth of data on visitor flows, user retention, conversion rates and much more. Below is an overview of the most important tools for your web analytics:
Google Analytics (GA4)
Google Analytics is one of the most frequently used web analytics tools on the market and is characterised by its versatile functions. It provides deep insights into visitor flows, cross-traffic, user engagement and conversion rates and integrates seamlessly with other Google services such as AdWords and Google Search Console. It is particularly attractive for small to medium-sized companies as it is free of charge.
Adobe Analytics
For companies looking for comprehensive and detailed data analysis, Adobe Analytics is the right choice. It offers advanced options for customer segmentation and campaign management, integrates machine learning and artificial intelligence for data analysis and forecasting. Large companies with complex data analysis and personalisation requirements will find a robust tool here.
Hotjar
Hotjar goes beyond traditional data analysis by offering heatmaps, session replays and surveys to understand the user experience on a more visual level. Direct feedback from users can be valuable for organisations of all sizes to identify weaknesses and improve the user experience.
Mixpanel
Mixpanel focuses on event tracking and makes it possible to track every action a user performs on the website in detail. This is particularly relevant for operators who want to gain a deep understanding of user interactions and optimise products or services in a targeted manner. Mixpanel is also suitable for companies of all sizes that are willing to pay for specialised analyses.
Matomo (formerly Piwik)
Matomo, formerly known as Piwik, positions itself as a privacy-friendly alternative to Google Analytics. It allows companies to host their analytics data themselves, which means full control over the data and addresses the data protection concerns of many users and organisations. It is particularly suitable for organisations that have to comply with strict data protection guidelines or prefer an open source solution.
Important KPIs and metrics
As previously discussed, traditional web analytics provides valuable insights into your audience and their interactions with your website. Tools such as Google Analytics, Mixpanel, Matomo and Adobe Analytics are designed to collect such data.
Although all of these platforms measure the core metrics in a similar way, Google Analytics is the tool favoured by most website operators due to its widespread use and comprehensive functionality. We therefore use Google Analytics 4 as an example below to explain the core web analytics metrics in more detail.
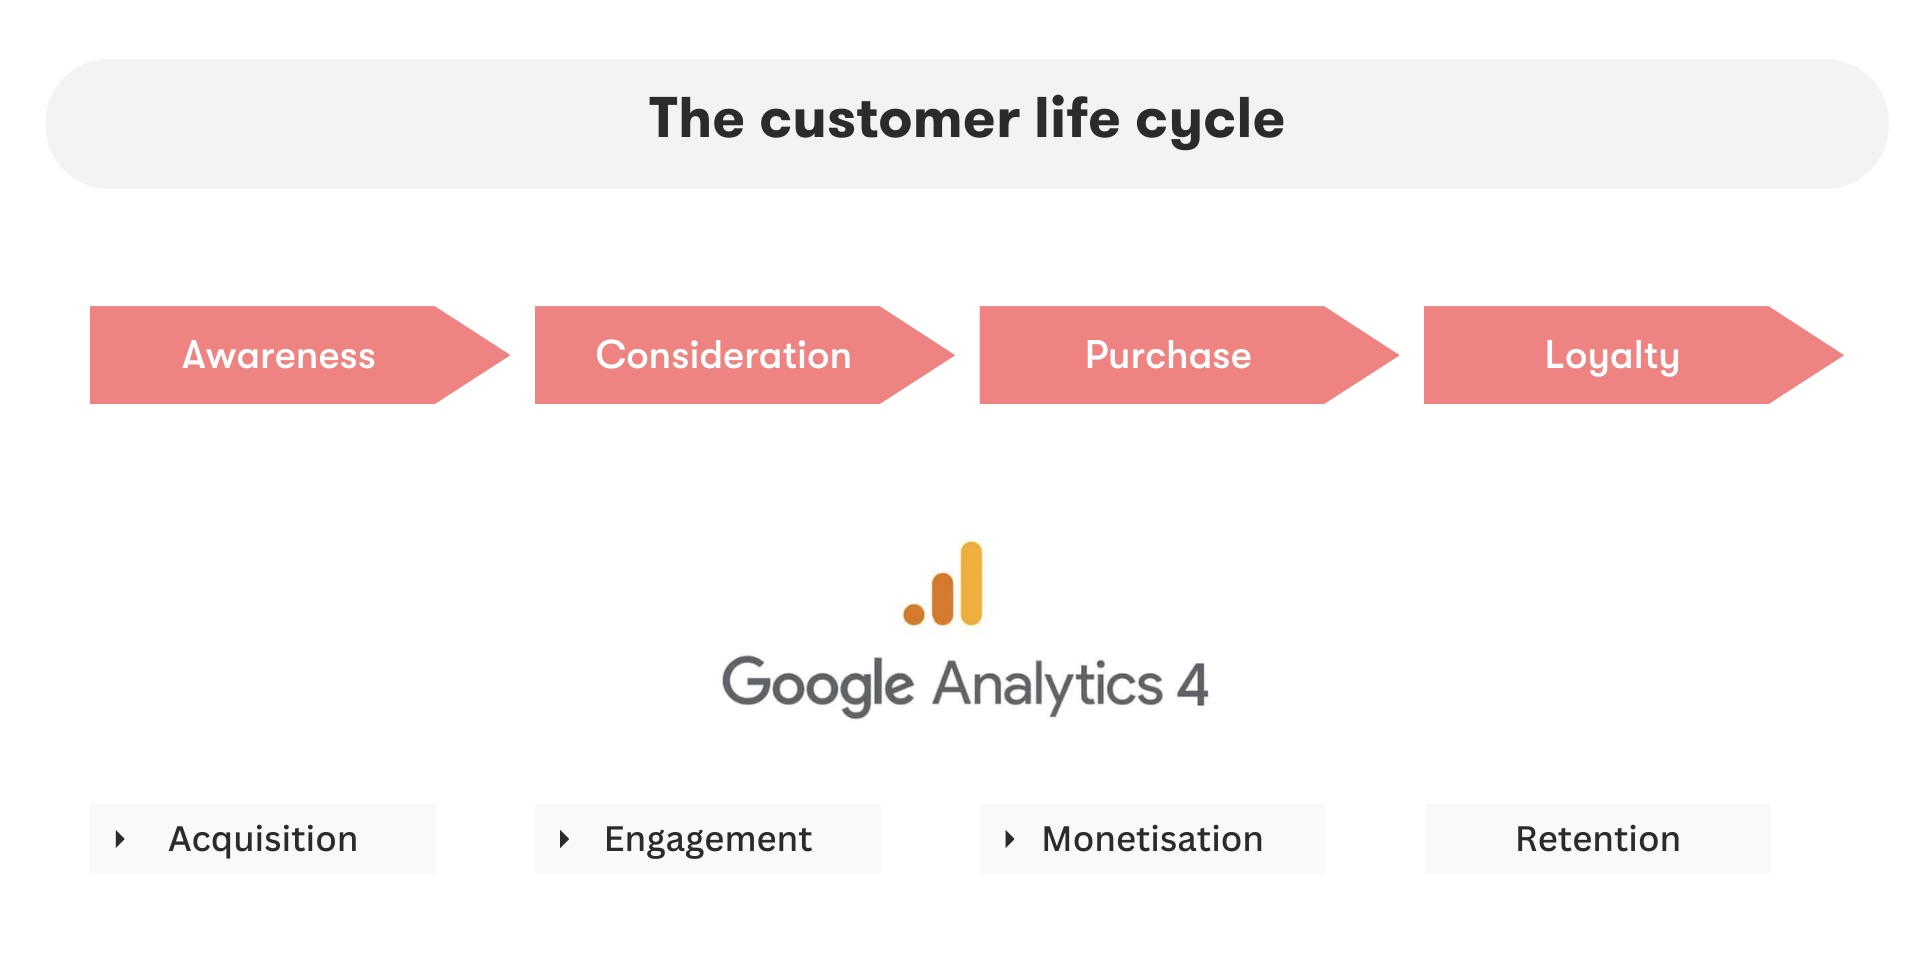
Since the switch from Google Universal Analytics to Google Analytics 4, there have been some changes to the core metrics. These are now divided into four categories in GA4: Acquisition, Engagement, Monetisation and Retention. The GA4 lifecycle reports are structured in such a way that they correspond to the phases of the classic customer lifecycle: Awareness, Consideration, Purchase and Retention.
But now to the most important core metrics in Google Analytics 4 for web analytics:
1. Acquisition
Acquisition-related metrics provide valuable insights into how visitors arrive at your website. This data is crucial to understanding your audience and how they access your online offering.
The most important metrics include:
- Users: This metric records the number of individual visitors to your website within a specified time frame. It is used to measure the reach of your offer and ensure that you are reaching the desired target group.
- New Users: This records how many visitors are coming to your site for the first time. It shows whether your customer acquisition strategies are successfully attracting new users to your website.
- Sessions: A session summarises all interactions that a user has during a visit to your site. This metric provides information about what visitors do on the website and how they interact with the content.
2. Engagement
Behavioural metrics (Engagement) record user behaviour on your website. They provide insight into user engagement by showing which content is attractive, how long visitors stay and how they interact.
The key metrics include:
- Engagement rate: The engagement rate replaces the UA metric "bounce rate". It provides useful information on the extent to which users have interacted with the website. For example, a high interaction rate for a blog post could mean that visitors are looking at further content after reading it.
- Engagement time: This is the little sister of the engagement rate and measures the average amount of time a user is active on your website. Active means that a user moves their cursor, clicks, scrolls or plays audio or video on an active tab in the browser window.
- Session Duration: The average amount of time users spend on the website per session. Longer session durations often indicate that the content is of particular interest to users and fulfils their needs, while shorter sessions may indicate the opposite.
- Pages per session: The average number of page views per session. A higher value indicates greater user engagement and shows that the content encourages visitors to explore more of your website.
- Exit Rate: Measures the frequency with which users leave the website via a specific page. This metric helps to identify at which points users end their journey on your website and which pages may need to be optimised.
3. Monetisation
Monetisation metrics (conversion metrics) are particularly relevant for online shop operators and evaluate how effective your online shop is at getting visitors to take desired actions, such as making a purchase. They measure how well you convert users into customers and how much revenue you generate.
The core metrics include:
- E-commerce conversion rate: Indicates the percentage of shop visitors who complete a purchase. This metric reflects the effectiveness of your online shop in converting users into buyers.
- Transactions: Shows the number of sales, the average transaction value and the total revenue. These figures provide information about the sales made and the financial success of your online business.
- Revenue: The total amount generated by sales on your website. It reflects the return on investment (ROI) of your marketing activities.
4. Retention
The "Retention" phase is aimed at analysing how good your website is at retaining users and keeping them coming back.
The core metrics include:
- Return Users: measures the number of unique users who return to your website after their first visit.
- Churn rate: indicates the percentage of users who have not returned to your website within a certain period of time after their first visit.
Web analytics tools such as Google Analytics 4 collect helpful quantitative data to measure the performance of your website. While these tools show what's happening on your website, they don't explain the "why" behind it.
It is therefore advisable to combine web analytics with tools that analyse user behaviour and product experience. This will give you a comprehensive picture of what users expect from your content and products, where they may encounter obstacles and what attracts their attention. In the following chapter, we will show you how you can use web analytics in your company.
How can I use web analytics for my company?
Now that we have taken a closer look at the basics of web analytics, you may be wondering how you can use it in your company. The use of web analytics in your company can be divided into four steps:
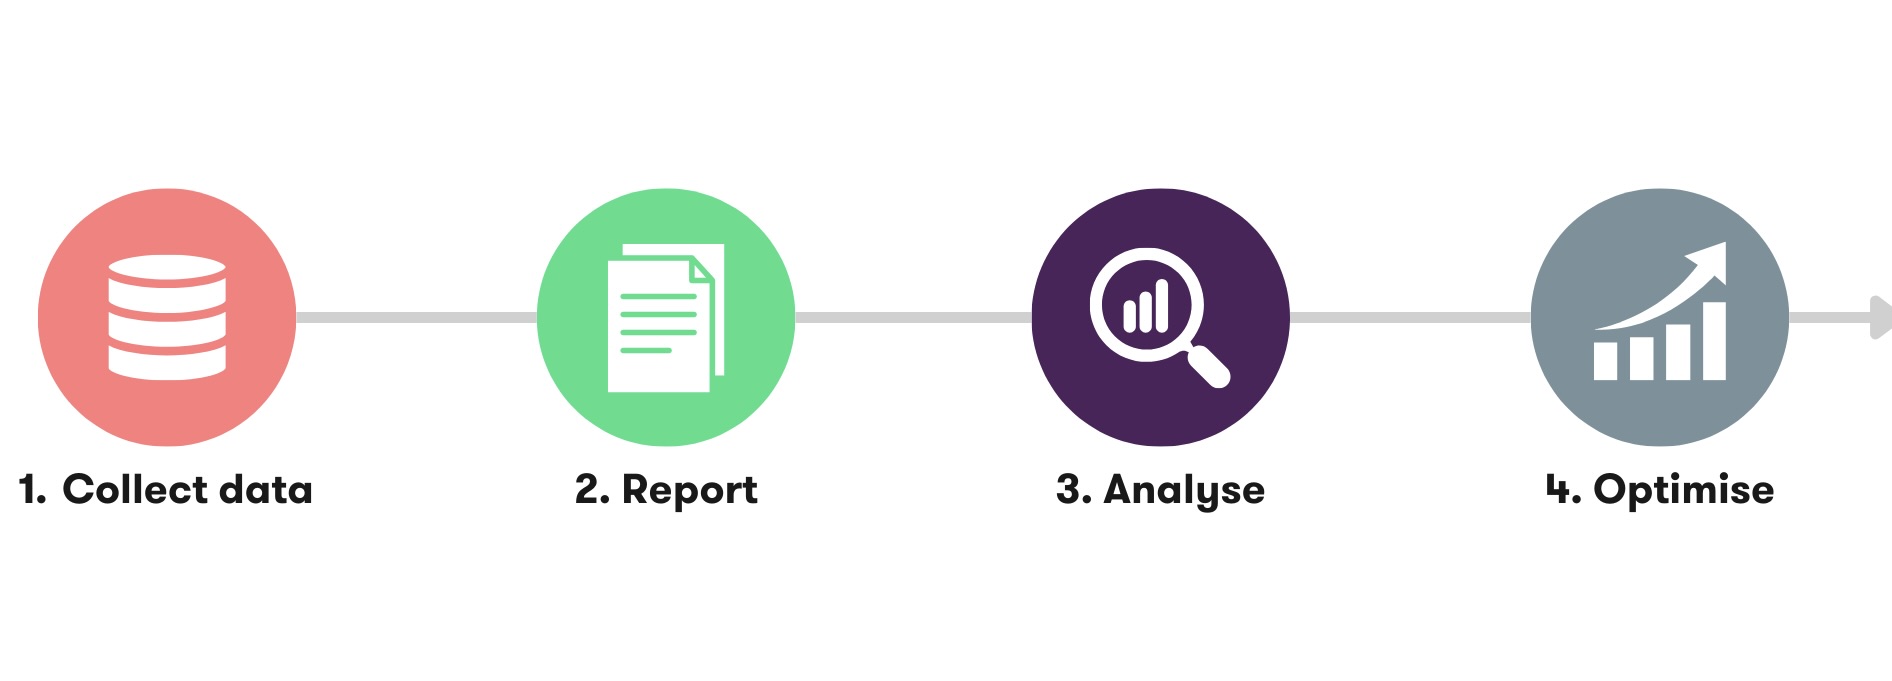
1. Data measurement/data collection
The first and decisive step in web analytics is data collection. The selection and configuration of suitable tools, such as Google Analytics, require care in order to avoid measurement errors. Precise setting of tracking parameters is essential in order to generate data that actually provides relevant insights.
2. Reporting
After you have set up an analysis tool, start collecting data. Pay particular attention to data protection. When using Google tools such as Google Analytics 4, the "Google Consent Mode" is of great importance, which is tailored to data protection requirements.
Once you have collected the data, reporting tools - such as "Google Looker Studio" - can help you transform this information into clear and understandable reports and dashboards. Such tools make it easier to analyse the data and gain valuable insights for your company.
3. Analysis
The analysis phase begins with the reports. In this step, it is first important to set clear goals. Defining clear goals before the analysis is essential in order to be able to make meaningful optimisations. Without these target definitions, misinterpretations can occur. For example, a high bounce rate on an information page could be wrongly interpreted as negative, even though it indicates that visitors are quickly finding what they are looking for. Knowing the marketing goals and the content of the website prevents optimisations from being carried out later on the basis of incorrect assumptions. The following therefore applies: only those who know their goal can successfully shape the path to it and achieve sustainable improvements.
Once the goals are clear, you can start with the web analysis. In this step, you analyse the data to identify patterns and trends. Questions such as "Where do my visitors come from?" or "Which pages have the highest bounce rates?" can be answered here.
4. Optimisation
Finally, you can develop optimisation strategies based on the analysis. This can mean improving the user experience, increasing the conversion rate or creating targeted content for specific visitor groups
How do I optimise my website?
The true potential of web analytics lies not just in the collection of data, but in the ability to use these insights to improve the performance of your website. In this chapter, we will discuss how you can optimise your website based on the data collected.
A/B testing
Don't just rely on your intuition - use A/B testing to test different versions of your website. This will help you identify the most effective elements and make evidence-based decisions about which elements perform best.
Hypothesise
Develop hypotheses based on your data analyses. For example, if the data shows a low interaction rate on the homepage, you could hypothesise that a clearer call-to-action or high-quality content with redirects could improve user engagement.
Optimise the user experience
The user experience (UX) is a central component of website optimisation. A positive UX can not only reduce the bounce rate, but also increase the conversion rate. Use the data to understand how visitors interact with your website. Where are there hurdles in the user flow? Which content is particularly popular or leads to a bounce? By removing barriers and highlighting popular content, you can significantly improve the user experience (UX).
Personalising the user experience
Data-based insights enable you to tailor content to the needs of your visitors. Use segmentation and personalisation to offer relevant content for different user groups and thus increase the relevance of your website.
Improve interface design and usability
Use data to support design decisions. For example, if users are struggling to find a particular button, this could be a sign of a design problem.
Shorten loading times
Loading time is a critical factor for user satisfaction. Use speed analyses to identify slow pages and optimise images, scripts and other resources.
Ensure mobile-friendliness
In an increasingly mobile world, it's important that your website works well on all devices. Use mobile traffic data to ensure that the mobile view of your website is optimised.
Conclusion
In order to use web analytics effectively and optimise the company website, a deeper understanding of user interactions is essential. Tools such as Google Analytics offer insights into visitor behaviour that can be used to optimise the digital presence in a targeted manner. The use of web analytics makes it possible to improve first impressions, personalise content and increase technical performance.
In order to exploit the full potential, it is crucial to use the collected data for A/B testing, UX optimisation and personalised user experiences. However, it is always important to clearly formulate the objectives of web analytics in order to be able to optimise correctly.